Aug 10, 2026
What GPU Does Your Robot Brain Need? VLA Benchmarks
Academic Research
We benchmarked four VLA models across five GPUs, from RTX 4090 to Blackwell B300. The gap is 34x. Here's the GPU your robot brain actually needs.
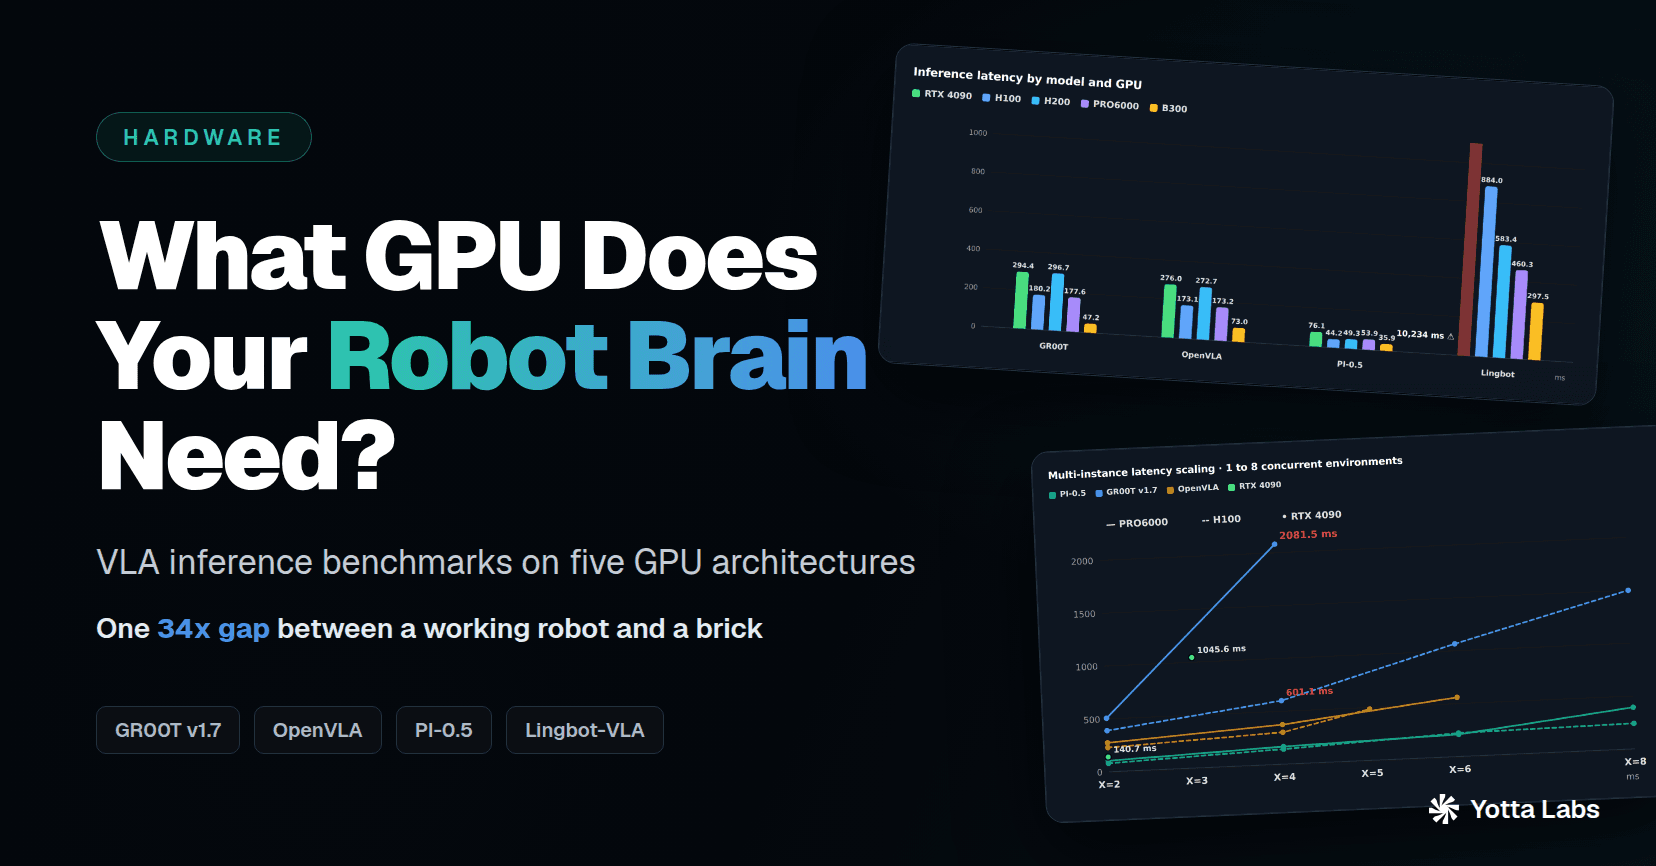
We benchmarked four Vision-Language-Action models across five GPU architectures — from an RTX 4090 to a Blackwell B300. The gap is 34×. Here's what GPU your robot brain actually needs.
Context
The 10 Hz deadline.
A robot arm catching a falling object needs to replan its trajectory every 100 milliseconds. A humanoid walking upstairs needs control updates at 50 Hz or faster. In both cases, the VLA model inside the robot has a hard deadline: generate the next set of actions before physics punishes the delay.
VLA models have made extraordinary progress in generalization — given a camera frame and a natural language instruction, they output joint positions, gripper commands, and mobile-base velocities directly. But generalization has a compute cost. We set out to answer a practical question: which GPU can actually run which VLA model at a control frequency that keeps the robot upright?
The answer turned out to be more nuanced — and more interesting — than "buy the most expensive one."
Models · the benchmark design
Four VLA models, five GPUs, batch size 1.
We benchmarked four state-of-the-art Vision-Language-Action models — GR00T v1.7, OpenVLA, PI-0.5, and Lingbot-VLA — across five GPU architectures spanning three hardware generations and five price points. Every measurement uses batch size 1, because that's what an actual robot runs.
GR00T v1.7. NVIDIA's humanoid-optimized policy. Predicts 40 actions per forward pass (chunk size 40) for long-horizon control — temporal chunking is what gives it high action throughput. The B300 and multi-instance runs use the GR1 humanoid embodiment: 29 grouped DoF (arms 7+7, hands 6+6, waist 3). Measured with the official release and its uv-locked environment (Python 3.10, transformers 4.51.3, Flash Attention 2).
OpenVLA. An open-source 7B-parameter generalist with a strict single-step policy (chunk size 1). Every forward pass re-encodes a novel camera frame through its SigLIP vision encoder, so visual prefill — not action decoding — dominates latency, with no amortization across steps. That makes it the clearest illustration of the per-inference floor discussed below. Measured with transformers 4.40.1 (the remote-code revision pinned by openvla-7b).
PI-0.5. Physical Intelligence's foundation model — a highly optimized architecture with chunk size 15 and the fastest raw latency in the suite (35.9 ms on a B300). Measured with the openpi environment (JAX, uv-locked for reproducibility). The B300 result required a toolchain upgrade — JAX 0.7.2 on CUDA 13.3 — to unlock native sm_103 support; see the B300 note below.
Lingbot-VLA. A flow-matching DiT (diffusion transformer) policy with chunk size 50 and diffusion-based action generation — the most demanding, most memory-hungry model in the suite. Its configurable chunk size (16–4096) and action dimension (16–512) make it our probe for architectural scaling laws: chunk-size invariance up to 1024 tokens, and action-dimension invariance from 16 to 512. Measured with PyTorch 2.12.1 and flash_attn_2.
GPUs
Five architectures spanning three generations. The L2-cache and bandwidth figures matter for the anomalies below:
RTX 4090 — Ada Lovelace, 24 GB GDDR6X, ~1,008 GB/s internal — consumer flagship
H100 — Hopper, 80 GB HBM3, 50 MB L2 — datacenter workhorse
H200 — Hopper, 141 GB HBM3e, 4.8 TB/s, 50 MB L2 — highest bandwidth in the suite
PRO6000 — Blackwell workstation, 96 GB GDDR7, ~1.8 TB/s, 128 MB L2
B300 — Blackwell Ultra HBM, 128 MB L2, compute capability sm_103
A word on method: Every benchmark runs at batch size 1 — the standard closed-loop, single-robot control scenario — using each model's official default configuration under a pinned software environment. No per-architecture quantization was applied; precision settings were held fixed across GPUs. We report two metrics: inference latency (ms per forward pass) and action throughput (actions per second = chunk size ÷ latency). Crucially, action throughput measures generation speed under open-loop execution and is an upper bound — a model's true closed-loop reactivity, how fast it can incorporate a new camera observation, is 1/latency. Every result below can be rerun from the commands and software environments at the end of this post.
Performance · measured results
The full benchmark matrix.
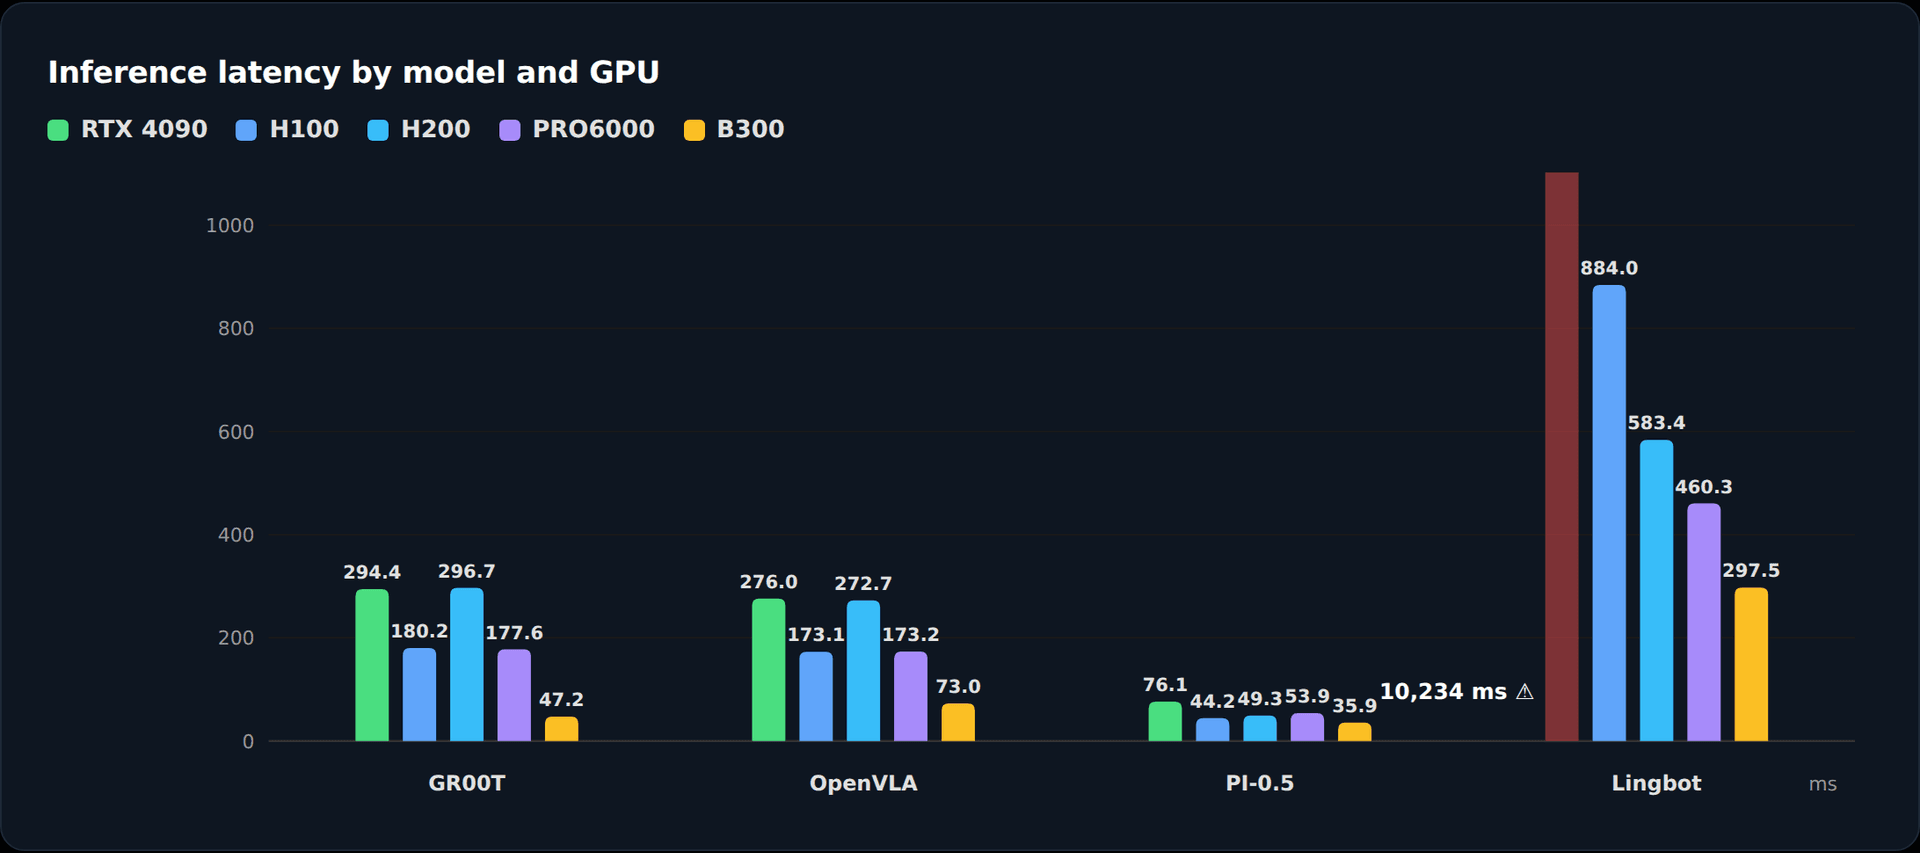
PI-0.5 delivers deployable latency everywhere — even on a consumer GPU. Lingbot-VLA on an RTX 4090 takes 10.2 seconds per action. The same model on a B300: 298 ms. That's a 34× gap, and the difference isn't just FLOPs.
Inference latency by model and GPU
PI-0.5 is the clear latency leader — 35.9 ms on the B300, now the fastest single number in the suite (H100: 44.2 ms) — OpenVLA plateaus at ~173 ms on H100 and PRO6000 (H200 excepted at 272.7 ms), and Lingbot-VLA on the RTX 4090 is catastrophically slow — 10,234 ms, off the chart. The B300 breaks OpenVLA's plateau at 73.0 ms — 2.4× faster than H100 despite the identical configuration. The near-identical H100/PRO6000 numbers still point to a per-inference floor that scales with neither compute nor bandwidth on Hopper/Ada-class GPUs — but Blackwell Ultra clears it.
| Model | RTX 4090 | H100 | H200 | PRO6000 | B300 |
| GR00T v1.7 | 294.4 | 180.2 | 296.7 | 177.6 | 47.2 |
| OpenVLA | 276.0 | 173.1 | 272.7 | 173.2 | 73.0 |
| PI-0.5 | 76.1 | 44.2 | 49.3 | 53.9 | 35.9 |
| Lingbot-VLA | 10,234.1 | 884.0 | 583.4 | 460.3 | 297.5 |
All values in milliseconds per forward pass. Lower is better.
Action throughput by model and GPU
Action throughput = chunk size ÷ latency. Chunk-based models (GR00T, PI-0.5, Lingbot-VLA on datacenter GPUs) comfortably exceed real-time requirements — GR00T v1.7 on the B300 leads the suite at 848 Hz (40 actions ÷ 47.2 ms), with PI-0.5 second at 418 Hz (15 actions ÷ 35.9 ms). OpenVLA's single-step policy caps at 5.8 Hz on Hopper/Ada-class GPUs — 13.7 Hz on the B300 — still below the 10–50 Hz typically needed for dynamic manipulation. But remember: throughput is not closed-loop reactivity. Lingbot-VLA on B300 delivers 168 Hz throughput yet only ~3.4 Hz reactivity (1/0.298 s).
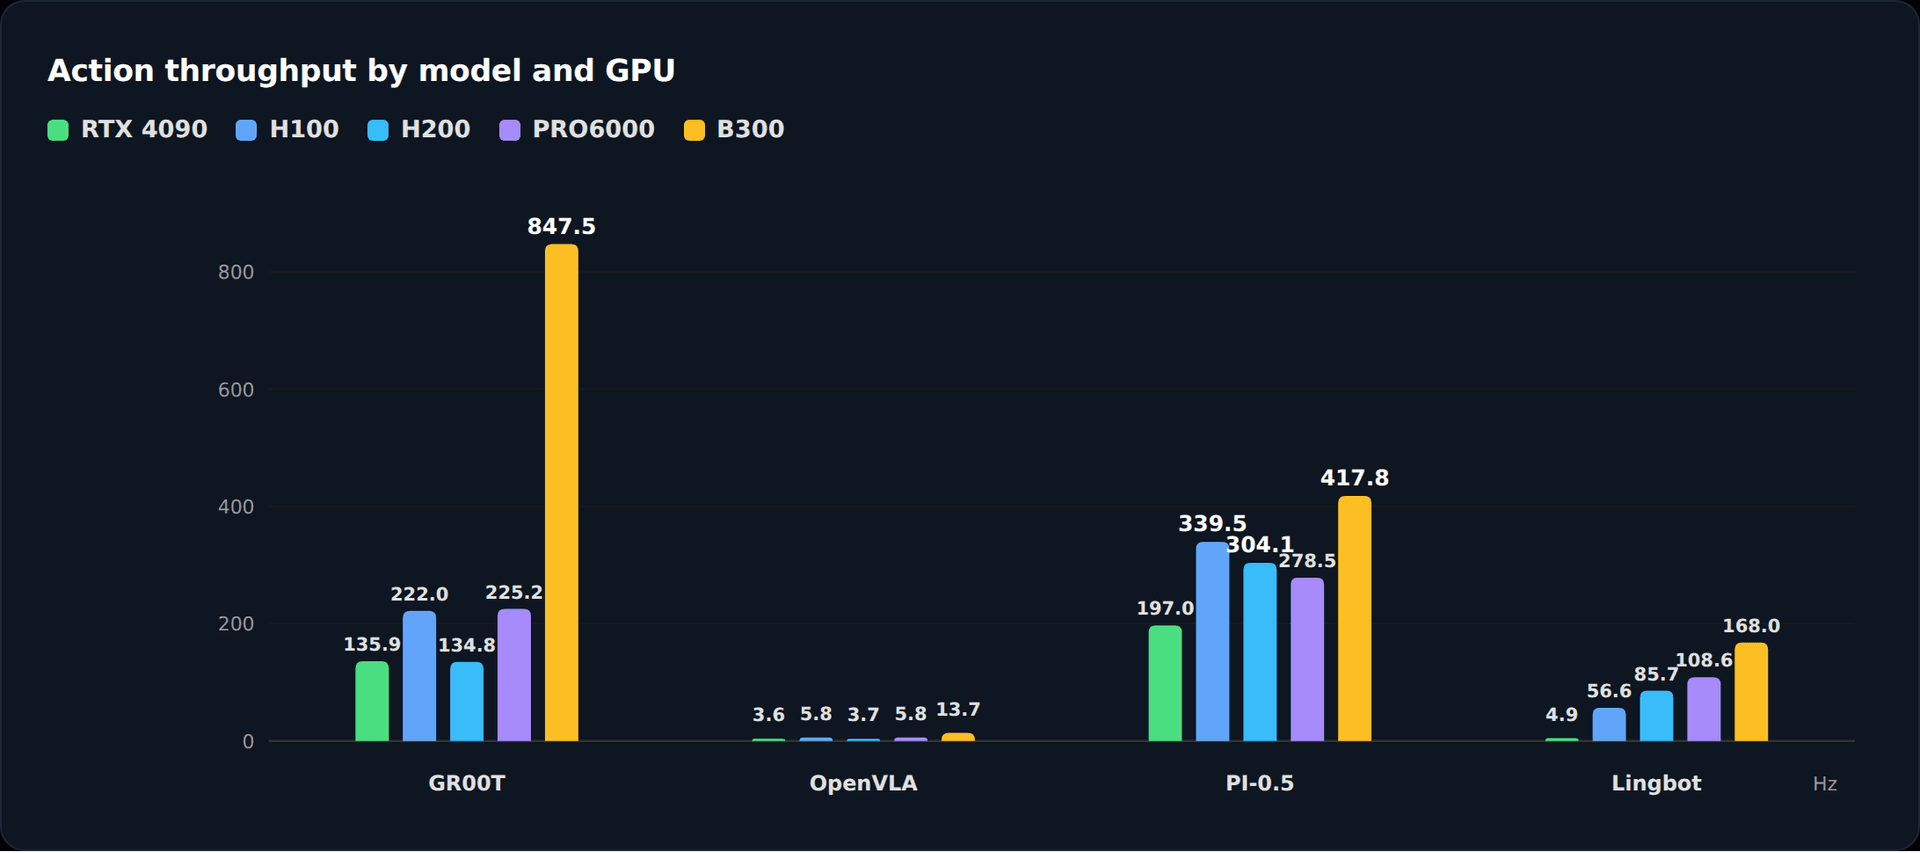
| Model | RTX 4090 | H100 | H200 | PRO6000 | B300 |
| GR00T v1.7 | 135.9 | 222.0 | 134.8 | 225.2 | 847.5 |
| OpenVLA | 3.6 | 5.8 | 3.7 | 5.8 | 13.7 |
| PI-0.5 | 197.0 | 339.5 | 304.1 | 278.5 | 417.8 |
| Lingbot-VLA | 4.9 | 56.6 | 85.7 | 108.6 | 168.0 |
All values in actions per second. Higher is better.
Findings · the anomalies
Three results that surprised us.
The headline numbers tell one story. The anomalies — the counterintuitive results that reveal how modern GPU architecture actually interacts with VLA inference — tell a deeper one.
The PCIe thrashing cliff — 10,234 ms. Lingbot-VLA on an RTX 4090 doesn't degrade gracefully — it falls off a cliff. The model's memory footprint exceeds 24 GB VRAM, forcing part of its state to be served from system RAM over PCIe 4.0. The GPU, designed for ~1,008 GB/s internal bandwidth, is throttled to ~32 GB/s — an order-of-magnitude collapse in effective bandwidth. The model still completes (it doesn't OOM), but at 10.2 seconds per pass, the robot has already failed.
PRO6000 vs H200 on Lingbot-VLA
The Blackwell workstation GPU (96 GB GDDR7, ~1.8 TB/s) beats the Hopper datacenter GPU (141 GB HBM3e, 4.8 TB/s) — 460 ms vs 583 ms. The H200 has 2.7× the memory bandwidth. The leading hypothesis: Blackwell's 128 MB L2 cache (2.5× the H200's 50 MB) retains more of the hot working set on-chip, reducing external DRAM traffic enough to overcome the bandwidth deficit. And the chunk-size sweep below confirms the mechanism: push the working set past the L2 (T≥2048) and the ordering reverses — H200 overtakes PRO6000. The same variable controls both directions. (Still a hypothesis pending direct L2 profiling, but now a controlled reversal rather than a single point.)
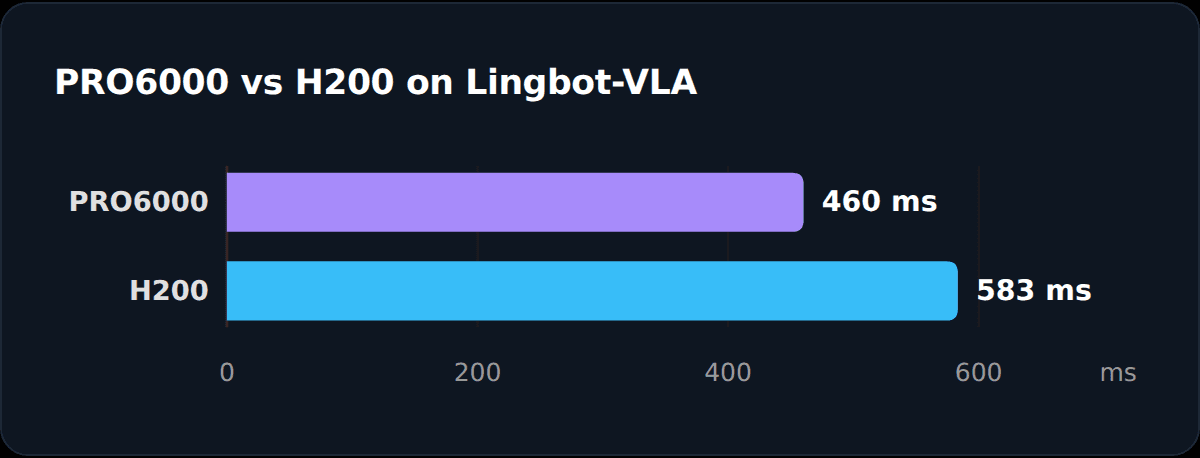
| GPU | Latency (ms) | Memory | Bandwidth |
| PRO6000 | 460.3 | 96 GB GDDR7 | ~1.8 TB/s |
| H200 | 583.4 | 141 GB HBM3e | 4.8 TB/s |
Lingbot-VLA default configuration, chunk size 50, action dimension 16.
OpenVLA's per-inference floor — and how B300 breaks it. OpenVLA latency: 173.1 ms on H100, 173.2 ms on PRO6000. Near-identical latency across GPUs with substantially different compute throughput and memory bandwidth indicates a bottleneck that scales with neither. The H200 corroborates: at 272.7 ms it's slowest despite the suite's highest bandwidth (4.8 TB/s) — if OpenVLA were bandwidth-bound, H200 would have been fastest. The floor plausibly comprises kernel-launch overhead and the fixed cost of re-encoding a novel camera frame at every step — the vision encoder (SigLIP) plus cross-attention prefill of hundreds of visual tokens. Since chunk size = 1, this cost is paid on every forward pass with no amortization. Temporal action chunking is not an optimization — it's an architectural necessity. The B300 sharpens the picture: at 73.0 ms the plateau does not survive Blackwell Ultra — its 128 MB L2 (2.5× the H100's 50 MB) plus Blackwell-native attention kernels roughly halve the per-step floor, while the sequential vision-encoding cost remains.
Under the hood — the engineering insight behind each anomaly
Each counterintuitive result maps to a specific hardware bottleneck:
| Observation | Measured result | Bottleneck |
| Lingbot-VLA on RTX 4090 | 294 → 10,234 ms | PCIe thrashing (34× slower) |
| PRO6000 vs H200 | 460 vs 583 ms | L2 cache hypothesis (2.5× larger) |
| H200 vs H100 | slower on every model | bandwidth ≠ latency-bound |
| OpenVLA plateau | 173 ms Hopper/Ada · 73 ms B300 | floor breaks on Blackwell Ultra |
| Chunk size ≤ 1024 | flat latency curve | compute-starved regime |
| Action dim 16 → 512 | 295–301 ms | near-complete invariance |
Scaling · chunk size & action dimension
How many actions should you predict at once?
We profiled Lingbot-VLA on three GPUs (H200, PRO6000, B300) across chunk sizes 16–4096 and action dimensions 16–512. The chunk-size sweep reveals more than a scaling law — it exposes a GPU crossover that independently confirms the L2 cache story.
Chunk size scaling · H200 vs PRO6000 vs B300
Flat to T=1024, then the order flips. For T ≤ 1024, PRO6000 (458 ms) beats H200 (560 ms) — its 128 MB L2 holds the working set. But at T=2048 the H200 (735 ms) overtakes the PRO6000 (904 ms), and at T=4096 the gap explodes (1,902 vs 2,771 ms). Once the O(T²) attention activations spill out of L2, execution becomes bound by external memory — and the H200's HBM3e (4.8 TB/s) crushes the PRO6000's GDDR7 (~1.8 TB/s). The same variable — working set vs L2 capacity — controls the ordering in both directions. That's the cache hypothesis making a testable prediction, and the data confirming it. B300 (large L2 + HBM) leads throughout.
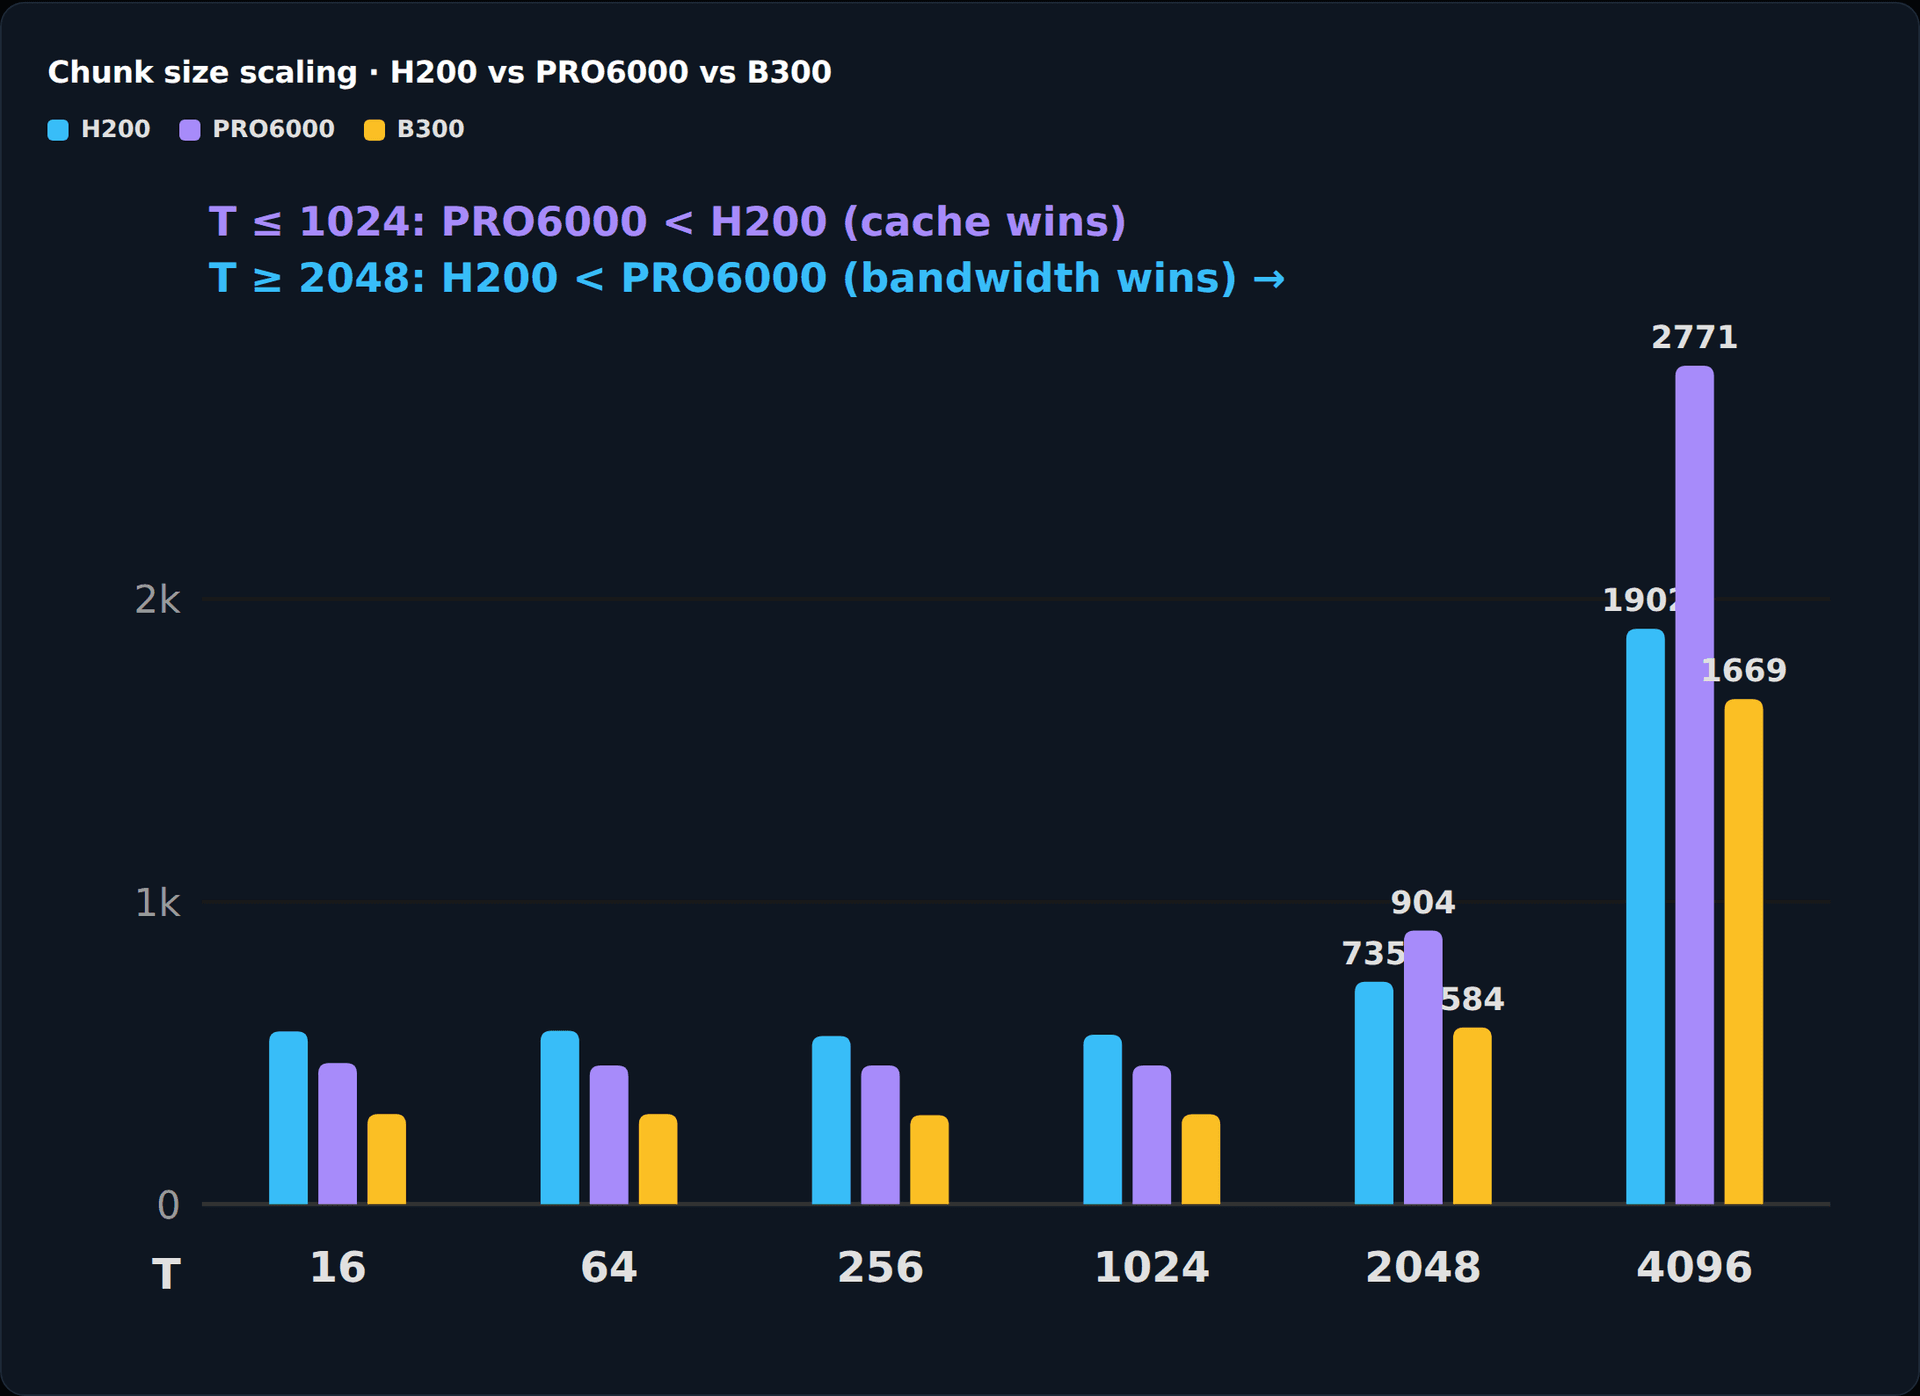
| Chunk | H200 | PRO6000 | B300 |
| 16 | 571 | 466 | 298 |
| 64 | 573 | 458 | 298 |
| 256 | 556 | 458 | 294 |
| 1024 | 560 | 458 | 297 |
| 2048 | 735 | 904 | 584 |
| 4096 | 1902 | 2771 | 1669 |
All values in milliseconds per forward pass. Action dimension fixed at 16.
Action dimension invariance · three GPUs
From 16 to 512 — a 32× increase in DoF — latency is flat on every GPU. B300 stays ~295–300 ms, PRO6000 ~460 ms, H200 ~578–596 ms. The DiT backbone complexity depends only on T and hidden dimension D_h; the final projection head O(T·D_h·D_a) is a rounding error given D_h ≥ 1024, dominated by kernel launch overhead rather than arithmetic. Encouraging for humanoid robotics: scaling from a 7-DoF arm to a 50-DoF whole-body controller adds no meaningful latency.
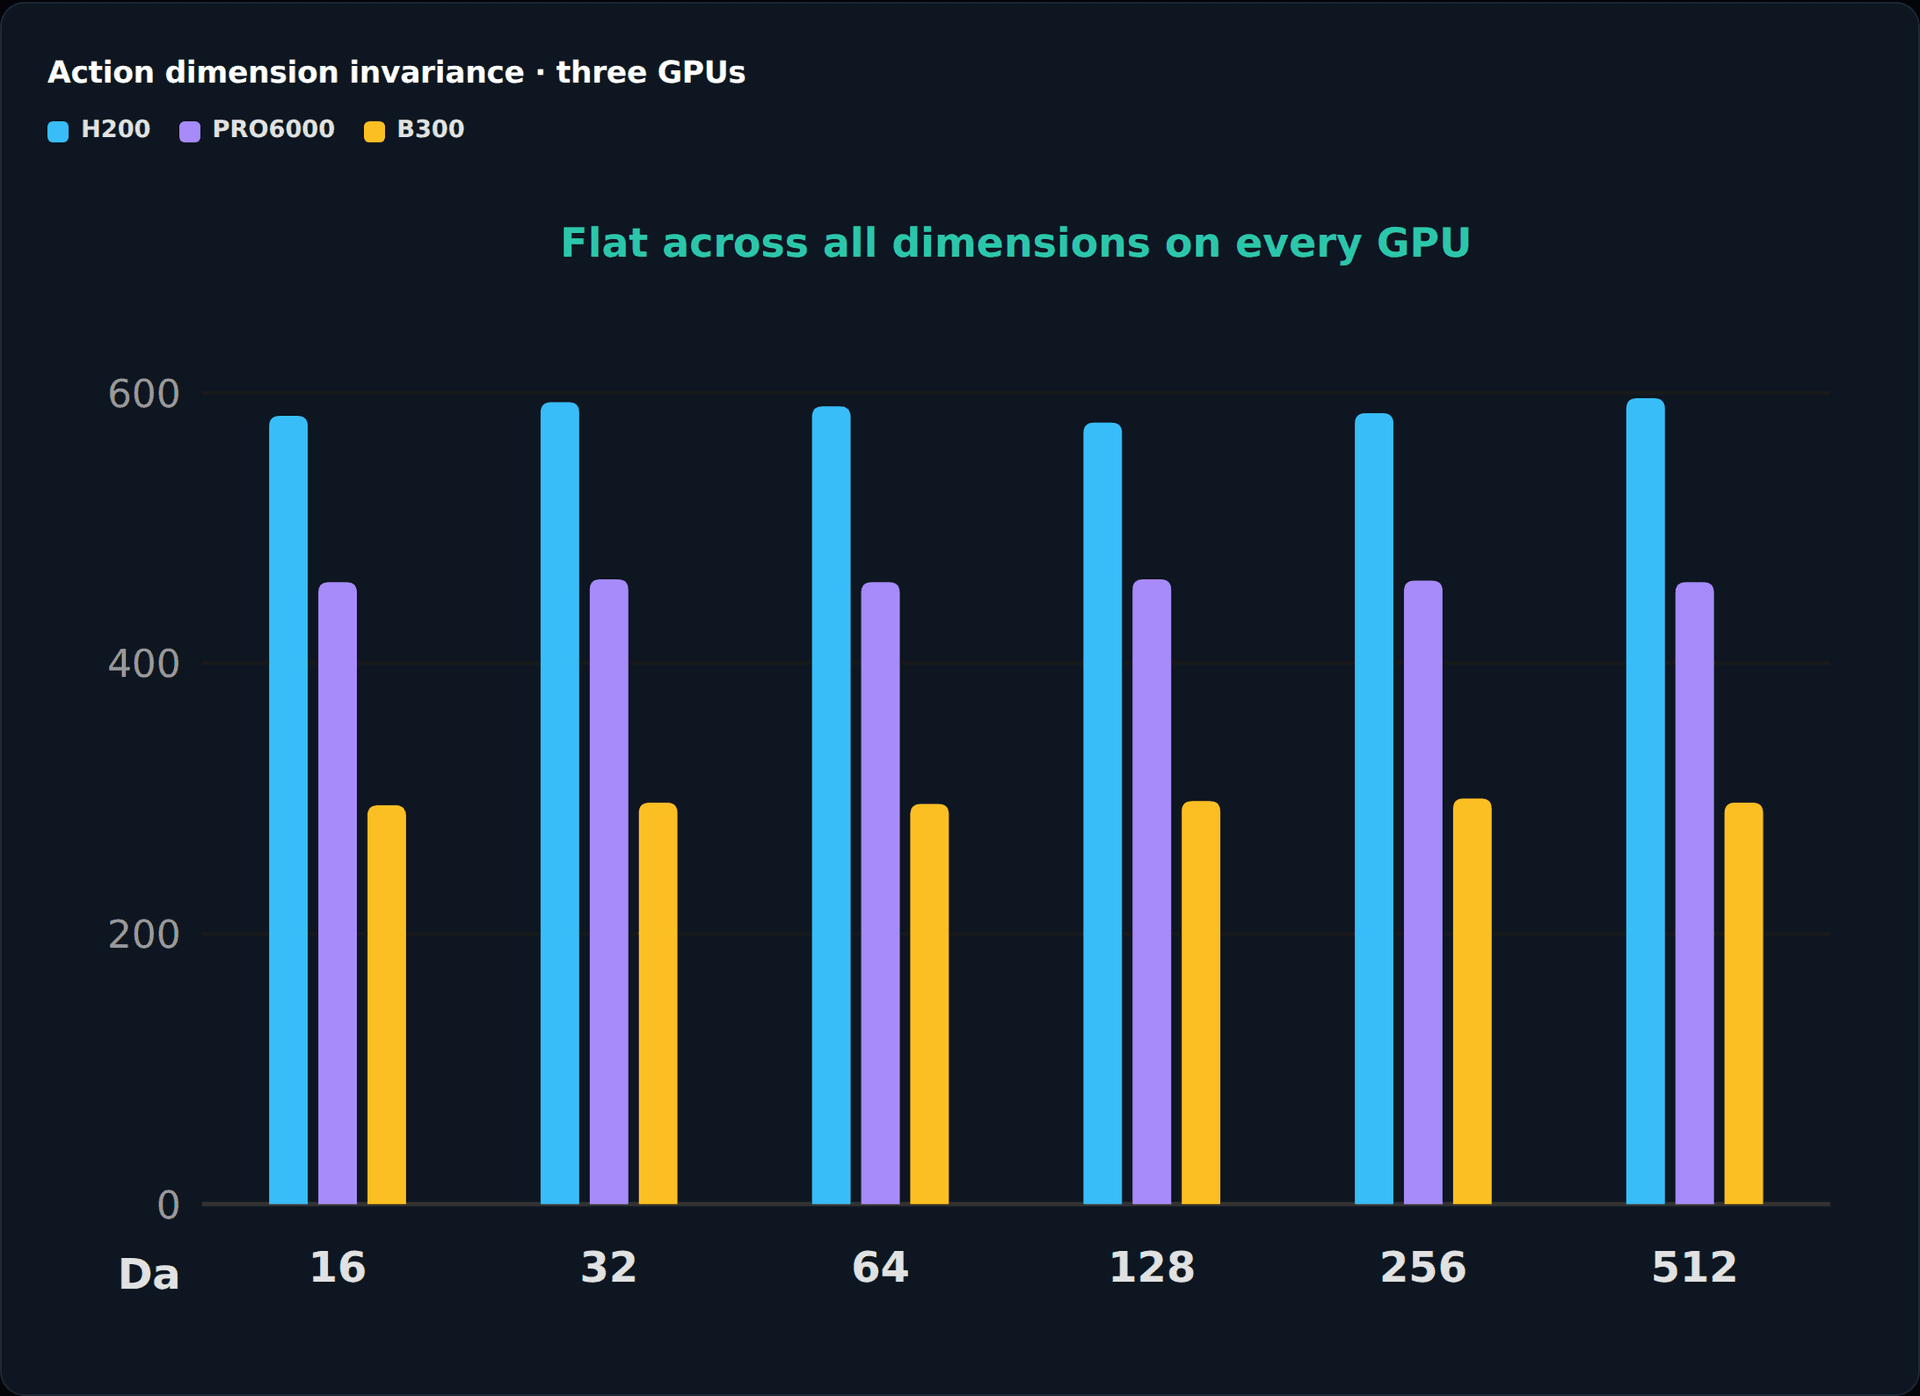
| Dim | H200 | PRO6000 | B300 |
| 16 | 583 | 460 | 295 |
| 32 | 593 | 462 | 297 |
| 64 | 590 | 460 | 296 |
| 128 | 578 | 462 | 298 |
| 256 | 585 | 461 | 300 |
| 512 | 596 | 460 | 297 |
All values in milliseconds per forward pass. Chunk size fixed at 50.
Multi-instance · fleet scaling
Running a robot fleet on one GPU.
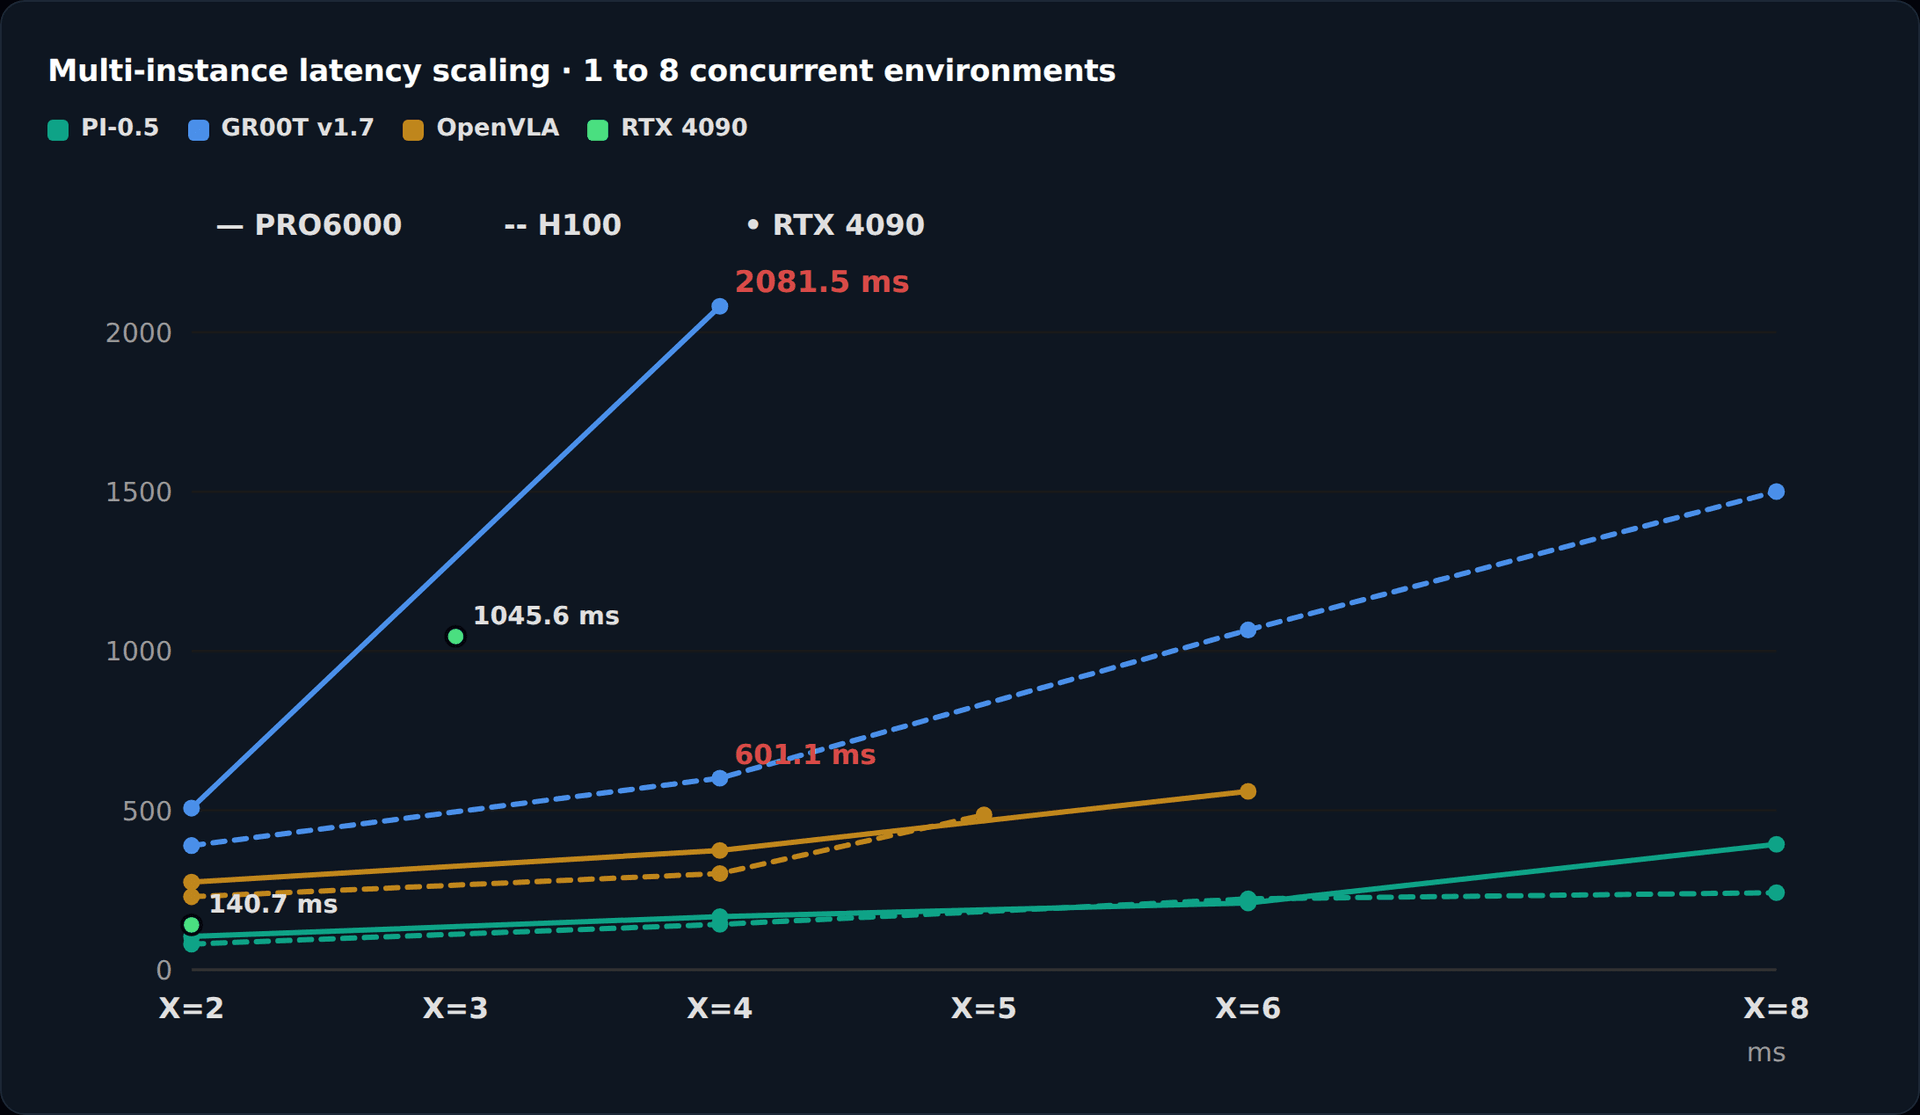
Single-robot benchmarks tell you about latency. Multi-instance benchmarks tell you about throughput — can one GPU serve 8 concurrent robots simultaneously? We found three distinct hardware boundaries.
Multi-instance latency scaling · 1 to 8 concurrent environments
Three degradation patterns emerge: (1) L2 cache crossover — PI-0.5 on PRO6000 briefly overtakes H100 at X=6 when the H100's 50 MB L2 overflows but PRO6000's 128 MB still holds; (2) bandwidth saturation — GR00T on PRO6000 spikes at X=4 from GDDR7 bus saturation despite ample VRAM; (3) PCIe thrashing — GR00T on RTX 4090 at X=3 from the 24 GB VRAM wall. OpenVLA fails outright on the RTX 4090 under any concurrency (OOM). Solid lines = PRO6000, dashed lines = H100, dots = RTX 4090.
| Model | GPU | X=2 | X=3 | X=4 | X=5 | X=6 | X=8 |
| PI-0.5 | RTX 4090 | 140.7 | — | — | — | — | — |
| PI-0.5 | H100 | 80.5 | — | 142.3 | — | 222.3 | 241.6 |
| PI-0.5 | PRO6000 | 104.2 | — | 166.5 | — | 209.4 | 393.4 |
| GR00T v1.7 | RTX 4090 | — | 1,045.6 | — | — | — | — |
| GR00T v1.7 | H100 | 389.5 | — | 601.1 | — | 1,066.0 | 1,500.2 |
| GR00T v1.7 | PRO6000 | 506.9 | — | 2,081.5 | — | — | — |
| OpenVLA | RTX 4090 | Out of memory at all concurrency levels | |||||
| OpenVLA | H100 | 229.0 | — | 301.7 | 485.8 | — | — |
| OpenVLA | PRO6000 | 274.9 | — | 374.2 | — | 559.7 | — |
All values in milliseconds per pass. Em-dash = concurrency level not measured for that configuration.
L2 cache crossover. PI-0.5 at X=6: PRO6000 (209 ms) overtakes H100 (222 ms) when the H100's 50 MB L2 overflows. By X=8 both caches overflow and the H100's HBM reasserts dominance — 241 ms vs 393 ms. Cache buys headroom, but only up to a point.
GDDR7 bandwidth saturation. GR00T on PRO6000 at X=4: 2,082 ms — not OOM (96 GB available), but GDDR7 bus saturation under concurrent memory access. The H100 absorbs X=8 at 1,500 ms. HBM is mandatory for multi-agent scaling of memory-intensive architectures.
Sub-linear scaling. OpenVLA on PRO6000: 275 ms (X=2) to 560 ms (X=6). The 7B LLM's concurrency bottleneck is visual token prefill. The 96 GB VRAM buffers 6 independent environment states — viable for edge-server deployments without HBM.
Deploy · decision matrix
What to use, when.
The benchmark data converges to a clear decision matrix. Here's what we recommend based on your deployment scenario.
| Scenario | Recommended config | Latency / throughput | Why |
| Single-arm pick-and-place | RTX 4090 + PI-0.5 | 76 ms · 197 Hz | Consumer sweet spot; leaves headroom for the rest of the control stack. |
| Humanoid, no compromises | H100 + GR00T v1.7 | 180 ms · 222 Hz | HBM handles multi-instance scaling gracefully — right for a fleet from one server. |
| Generalist manipulation | B300 + PI-0.5 | 36 ms · 418 Hz | Fastest config in the suite (H100 second at 44 ms). Maximum reactivity. |
| Humanoid on a budget | PRO6000 + GR00T v1.7 | 178 ms · 225 Hz | Blackwell workstation GPU; H100-competitive latency at lower cost. |
| Diffusion-based VLA | B300 or PRO6000 + Lingbot-VLA | 298 ms / 460 ms | DiT action generation needs datacenter/high-end workstation GPUs. Not viable on 24 GB cards. |
| Fleet of 6+ robots | H100 + PI-0.5 or OpenVLA | sub-600 ms at X=6 | HBM is mandatory for concurrent multi-agent inference of memory-intensive models. |
Three rules of thumb from the data
1. VRAM is binary. If your model's working set exceeds the GPU's VRAM, nothing else matters. PCIe thrashing turns a capable GPU into a paperweight. For DiT-based VLAs, 24 GB is below the viable floor.
2. Raw bandwidth predicts nothing at batch-1. A large L2 cache (128 MB on Blackwell) can overcome a 2.7× bandwidth disadvantage — and the inverse holds too: the H200, our highest-bandwidth GPU, lost every matchup in the suite. Cache and latency behavior decide.
3. Temporal chunking is the cheapest speedup. Moving from chunk size 1 to 15 delivers a 50× throughput improvement by amortizing the per-inference floor. But remember: throughput ≠ reactivity. Your closed-loop control rate is still 1/latency.
Credibility
Every number on this page is reproducible.
All tests use batch size 1, official model default configurations, and pinned software environments. No per-architecture quantization was applied. Every result can be independently verified with access to the hardware.
All four models are open-weight, and the GPU architectures span consumer (RTX 4090), datacenter (H100, H200), and workstation (PRO6000, B300) classes. The full software stack — Python version, PyTorch/JAX version, attention backend — is documented per model and GPU combination below.
# Software environments (excerpt)
Lingbot-VLA · All GPUs  · Python 3.12.3 · PyTorch 2.12.1 · flash_attn_2
OpenVLA · PRO6000/4090  · Python 3.12.3 · PyTorch 2.12.0.dev
OpenVLA · H100         · Python 3.10.12· PyTorch 2.7.1+cu128
OpenVLA · H200         · Python 3.10   · PyTorch (conda, pytorch-cuda=12.4)
OpenVLA · B300          · Python 3.12   · PyTorch 2.12.0+cu130 · transformers 4.40.1
PI-0.5  · 4090/H100/H200/PRO6000 · Python 3.12 (uv-locked) · JAX[cuda12]
PI-0.5  · B300             · Python 3.11 · JAX[cuda13] 0.7.2 + orbax-checkpoint 0.11.20
GR00T v1.7 · All GPUs incl. B300 · Python 3.10 · uv-locked · transformers 4.51.3 + FA2
# All tests: batch_size=1, official default configs, no per-GPU quantization
For the complete benchmark methodology, mathematical derivations of the scaling laws, and per-configuration software environments, read the full technical report.
Field note · the B300 measurement
Why the default install crashes on a B300 — and what fixed it.
The B300 column for PI-0.5 in every chart above started as a crash log, not a number. The model was never the problem — the software toolchain was. This is the full post-mortem: why the pinned environment couldn't run on Blackwell Ultra, the temporary patch, and the version upgrade that unlocked the native hardware.
1 · The default install died on the first compile
openpi pins jax[cuda12]==0.5.3, which ships an April-2025 CUDA 12.x toolchain. XLA in that build does not know the B300's compute capability (10.3 / sm_103). Instead of failing loudly, it falls back to targeting sm_101 — while still generating Blackwell tcgen05 tensor-core instructions for its Triton GEMM fusions. ptxas rejects those on a plain sm_101 target, and the process aborts in the middle of GEMM autotuning:
# python test.py — first run on the B300
Unknown compute capability 10.3. Defaulting to telling LLVM that we're compiling for sm_101
ptxas : error : Instruction 'tcgen05.alloc' not supported on .target 'sm_101'
ptxas : error : Instruction 'tcgen05.mma' not supported on .target 'sm_101'
Fatal : Non-OK-status: executable.status() → Aborted (core dumped)
2 · Diagnosis: a toolchain gap, not a model bug
The B300 is Blackwell Ultra, and tcgen05 instructions are only legal on suffixed architecture targets (sm_100a / sm_103a), which require a CUDA 13.0+ toolchain to compile. jaxlib 0.5.3's architecture table stops at sm_101/sm_120, and its bundled ptxas predates sm_103 entirely. In short: the model was fine; the compiler didn't know the hardware.
3 · First patch: disable the fusions — it ran, but slowly
The quick workaround routed every matmul through cuBLAS (which supports the B300 internally) by disabling XLA's inline-PTX Triton GEMM fusions with XLA_FLAGS=--xla_gpu_enable_triton_gemm=false. That unblocked the benchmark immediately — but at 91.3 ms per inference. cuBLAS 12.x had no native sm_103 kernels, kernel fusion was off, and the GPU's fifth-generation tensor cores sat idle.
4 · The real fix: upgrade the toolchain, keep the code
jax 0.7.0 is the first release with a cuda13 extra. Installing jax[cuda13]==0.7.2 brings the CUDA 13.3 toolchain and an XLA that natively knows sm_103a — tcgen05 GEMM fusions compile and run as designed. One wrinkle: openpi's pinned orbax-checkpoint==0.11.13 breaks under jax 0.7 (the DeviceLocalLayout API moved), while 0.11.25+ breaks openpi's own checkpoint-metadata access. A bisect over the wheel history found orbax-checkpoint==0.11.20 as the only release compatible with both. After removing the stale cuda12 plugin artifacts, the unmodified test.py ran end to end.
# the upgrade (openpi venv, Python 3.11)
uv pip install "jax[cuda13]==0.7.2" "orbax-checkpoint==0.11.20"
uv pip uninstall jax-cuda12-plugin jax-cuda12-pjrt   # stale plugins caused a PJRT registration conflict
# python test.py — no flags, no code changes → 35.9 ms / infer
The three outcomes, side by side
| Stage | Configuration | Result |
| Default install | jax 0.5.3 + CUDA 12.x toolchain | Fatal ptxas abort — tcgen05 rejected on fallback sm_101 |
| Temporary workaround | cuBLAS fallback (--xla_gpu_enable_triton_gemm=false) | 91.3 ms · 2.5× slower · Blackwell tensor cores idle |
| Toolchain upgrade | jax[cuda13] 0.7.2 + orbax-checkpoint 0.11.20 | 35.9 ms · 417.8 Hz · native sm_103a, zero code changes |
The lesson transfers beyond this benchmark: a GPU's compute capability is a hard compatibility contract with the software stack. Blackwell Ultra requires a CUDA 13-era toolchain — no amount of model tuning will compile around an architecture the compiler doesn't know. With the right toolchain, PI-0.5 on the B300 delivers 35.9 ms (≈418 Hz action throughput), 19% faster than its H100 result (44.2 ms). The same contract governed the OpenVLA measurement: its PyTorch stack needed a CUDA 13-era wheel (torch 2.12.0+cu130) to run natively on sm_103 — yielding 73.0 ms, the fastest OpenVLA number in the suite. GR00T v1.7 needed no changes at all: its uv-locked stack (torch 2.7.1+cu128, transformers 4.51.3, flash-attn 2.7.4) ran natively on the B300 via sm_100-compatible kernels — 47.2 ms, 3.8× faster than its H100 result (180.2 ms), measured with the same chunk-40 action horizon as the other rows (GR1 grouped actions, 29 DoF: arms 7+7, hands 6+6, waist 3). The em-dashes in the B300 columns are now measured cells.
uv venv --python 3.12 .venv
uv pip install torch==2.12.0 torchvision --index-url https://download.pytorch.org/whl/cu130
uv pip install -r requirements-min.txt accelerate
Four VLA models. Five GPUs. One 34× gap between a working robot and a brick. Choose your hardware before physics chooses for you.
VLA Inference Benchmarks · Yotta Labs & Fractal Labs. All figures measured with a standardized harness under pinned model revisions, batch size 1 throughout, no per-architecture quantization. Every number is reproducible from the commands and software environments above; full methodology in the technical report.